
IoT Power Monitoring
A real-time IoT-based power monitoring and energy analytics system designed to track electrical consumption, visualize live device metrics, estimate energy costs, and remotely control connected devices through SSR relays.
Tech Stack
Why I Built This
Most small-scale power monitoring solutions either lack real-time visibility, provide poor historical analytics, or rely on expensive proprietary hardware ecosystems. I wanted to build a lightweight and scalable monitoring platform that combines embedded systems, cloud infrastructure, and real-time web technologies into a single system.
The project was designed to monitor electrical metrics such as voltage, current, power consumption, and power factor from multiple IoT devices in real time. It also provides energy cost estimation, monthly consumption analytics, relay-based device control, and device timeout monitoring to detect inactive or disconnected hardware automatically.
How It Works
ESP32-based monitoring devices continuously collect electrical readings including voltage, current, power consumption, and power factor from connected sensors. These readings are transmitted to a Node.js backend through HTTP requests at fixed intervals.
The backend processes incoming telemetry and stores high-frequency time-series data in InfluxDB for efficient real-time querying and analytics. To avoid retention and storage limitations, aggregated daily energy summaries are periodically transferred into MongoDB as long-term cold storage for monthly and historical analysis.
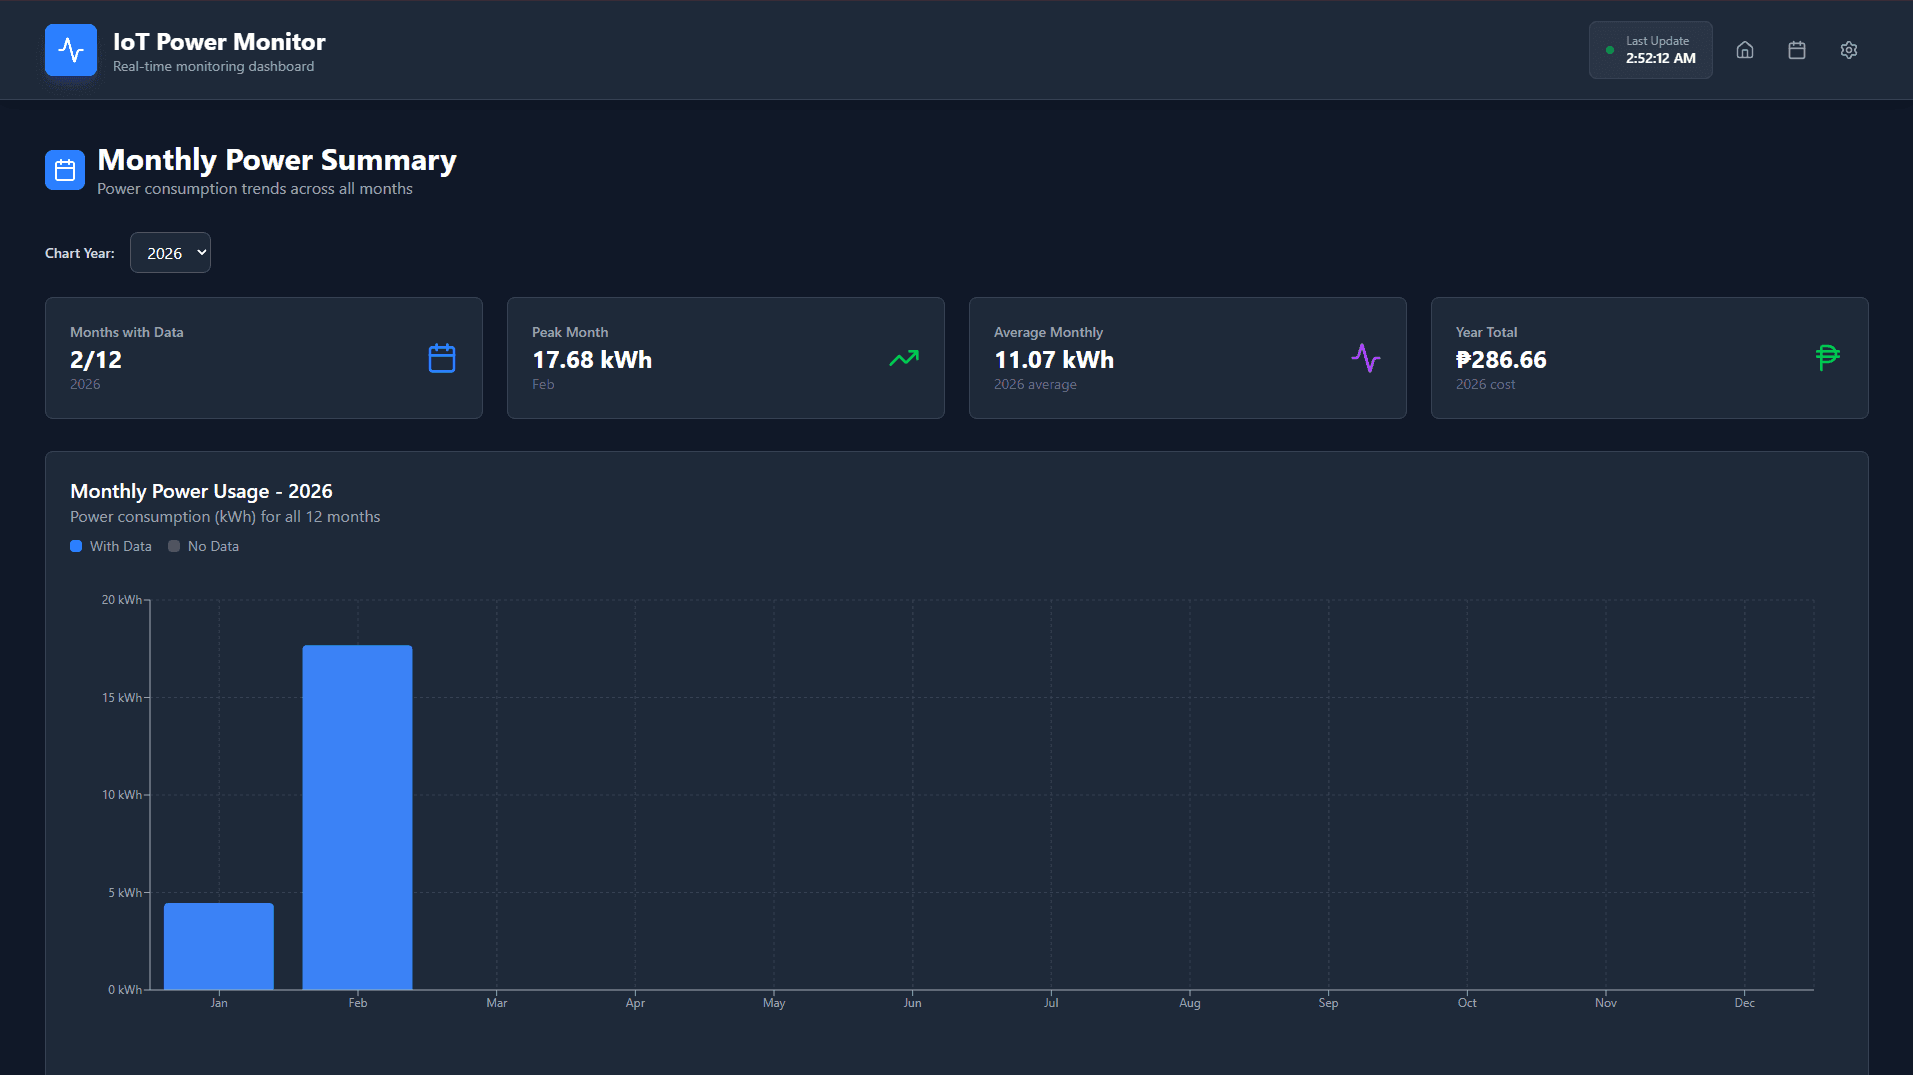
Real-time device updates are streamed to the React frontend using WebSockets, eliminating the need for constant database polling and reducing unnecessary backend load. The frontend visualizes live power consumption, historical usage trends, and estimated electricity costs through interactive charts and dashboards.
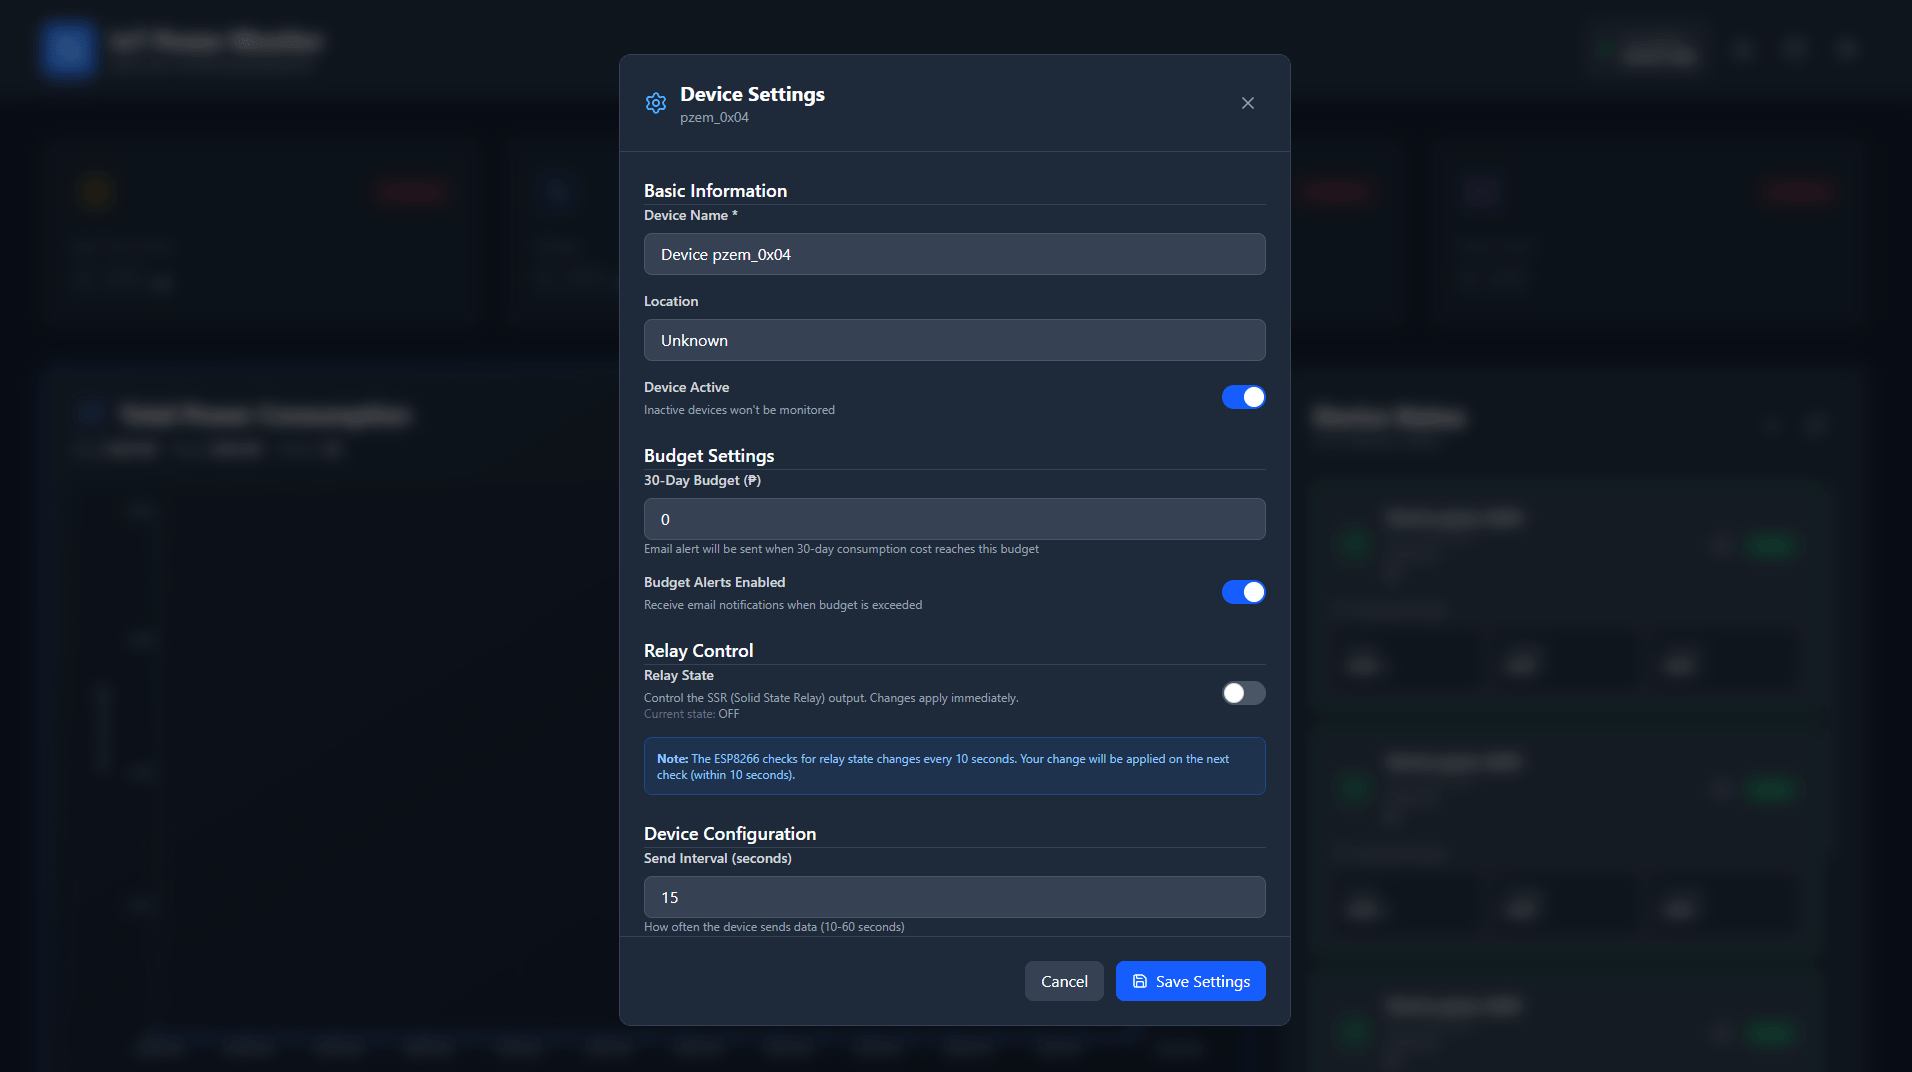
The system also supports SSR relay control, allowing users to remotely toggle connected devices through the web application. A device timeout monitoring mechanism tracks the last active timestamp of each ESP32 device and automatically flags devices that stop transmitting data.
Key Decisions
Hybrid Database Architecture
InfluxDB was used for high-frequency time-series telemetry because it is optimized for continuous sensor writes and real-time aggregation queries. MongoDB was introduced as long-term cold storage for aggregated daily summaries and monthly analytics to avoid retention limitations and reduce infrastructure costs.
WebSockets over polling
Instead of continuously polling the database for updates, the backend broadcasts incoming readings through WebSockets immediately after ingestion. This significantly reduces unnecessary queries while enabling near real-time updates in the frontend dashboard.
wsServer.clients.forEach(client => {
  if (
    client.readyState === WebSocket.OPEN &&
    client.subscriptions?.has(deviceId)
  ) {
    try {
      client.send(JSON.stringify(payload));
    } catch (err) {
      client.terminate();
      wsServer.clients.delete(client);
      console.error("Failed to send WS message:", err);
    }
  }
})
Device timeout monitoring
IoT devices can unexpectedly disconnect due to power interruptions or unstable network conditions. To address this, each device maintains a last-seen timestamp that is continuously updated whenever telemetry is received. Devices exceeding a configurable inactivity threshold are automatically marked as offline within the dashboard.
Aggregation-first analytics
Rather than querying raw sensor readings for monthly reports, the system aggregates daily energy summaries before storing them in MongoDB. This reduces computational overhead and enables fast historical analytics even after older InfluxDB data expires.
What I Learned
This project significantly improved my understanding of distributed IoT architectures, real-time data streaming, and scalable telemetry processing.
I learned how to properly separate hot and cold storage responsibilities using InfluxDB and MongoDB, design efficient aggregation pipelines for energy analytics, and build event-driven real-time systems using WebSockets.
The project also strengthened my firmware development workflow, particularly around ESP32 networking, offline handling strategies, Wi-Fi provisioning with WiFiManager, and relay control through SSR modules.
Beyond the technical implementation, I gained deeper experience in designing systems that balance performance, scalability, and infrastructure constraints while operating within free-tier cloud deployment limitations.